Lalitha Sundaresan, Sheena G Sullivan, David J Muscatello, Daneeta Hennessy, Stacey L Rowe
{"title":"Monitoring mortality in the setting of COVID-19 pandemic control in Victoria, Australia: a time series analysis of population data.","authors":"Lalitha Sundaresan, Sheena G Sullivan, David J Muscatello, Daneeta Hennessy, Stacey L Rowe","doi":"10.5365/wpsar.2025.16.01.1091","DOIUrl":null,"url":null,"abstract":"<p><strong>Objective: </strong>Mortality surveillance was established in the state of Victoria just before the COVID-19 pandemic. Here, we describe the establishment of this surveillance system, justify the modelling approach selected, and provide examples of how the interpretation of changes in mortality rates during the pandemic was influenced by the model chosen.</p><p><strong>Methods: </strong>Registered deaths occurring in Victoria from 1 January 2015 to 31 December 2020 were sourced from the Victoria Death Index. Observed mortality rates were compared to a raw historical 5-year mean and to predicted means estimated from a seasonal robust regression. Differences between the observed mortality rate and the historical mean (∆MR) and excess mortality rate from the observed and predicted rates were assessed.</p><p><strong>Results: </strong>There were 20 375 COVID-19 cases notified in Victoria as of 31 December 2020, of whom 748 (3.7%) died. Victorians aged ≥ 85 years experienced the highest case fatality ratio (34%). Mean observed mortality rates in 2020 (MR: 11.6; 95% confidence interval [CI]: 11.4, 11.9) were slightly reduced when compared with the annual rate expected using the historical mean method (mean MR: 12.2; 95% CI: 12.1-12.3; ∆MR: -0.57; 95% CI: -0.77, -0.38), but not from the rate expected using the robust regression (estimated MR: 11.7; 95% prediction interval [PI]: 11.5, 11.9; EMR: -0.05; 95% CI: -0.26, 0.16). The two methods yielded opposing interpretations for some causes, including cardiovascular and cancer mortality.</p><p><strong>Discussion: </strong>Interpretation of how pandemic restrictions impacted mortality in Victoria in 2020 is influenced by the method of estimation. Time-series approaches are preferential because they account for population trends in mortality over time.</p>","PeriodicalId":31512,"journal":{"name":"Western Pacific Surveillance and Response","volume":"16 1","pages":"1-11"},"PeriodicalIF":1.1000,"publicationDate":"2025-01-16","publicationTypes":"Journal Article","fieldsOfStudy":null,"isOpenAccess":false,"openAccessPdf":"https://www.ncbi.nlm.nih.gov/pmc/articles/PMC11855116/pdf/","citationCount":"0","resultStr":null,"platform":"Semanticscholar","paperid":null,"PeriodicalName":"Western Pacific Surveillance and Response","FirstCategoryId":"1085","ListUrlMain":"https://doi.org/10.5365/wpsar.2025.16.01.1091","RegionNum":0,"RegionCategory":null,"ArticlePicture":[],"TitleCN":null,"AbstractTextCN":null,"PMCID":null,"EPubDate":"2025/1/1 0:00:00","PubModel":"eCollection","JCR":"Q4","JCRName":"PUBLIC, ENVIRONMENTAL & OCCUPATIONAL HEALTH","Score":null,"Total":0}
引用次数: 0
Abstract
Objective: Mortality surveillance was established in the state of Victoria just before the COVID-19 pandemic. Here, we describe the establishment of this surveillance system, justify the modelling approach selected, and provide examples of how the interpretation of changes in mortality rates during the pandemic was influenced by the model chosen.
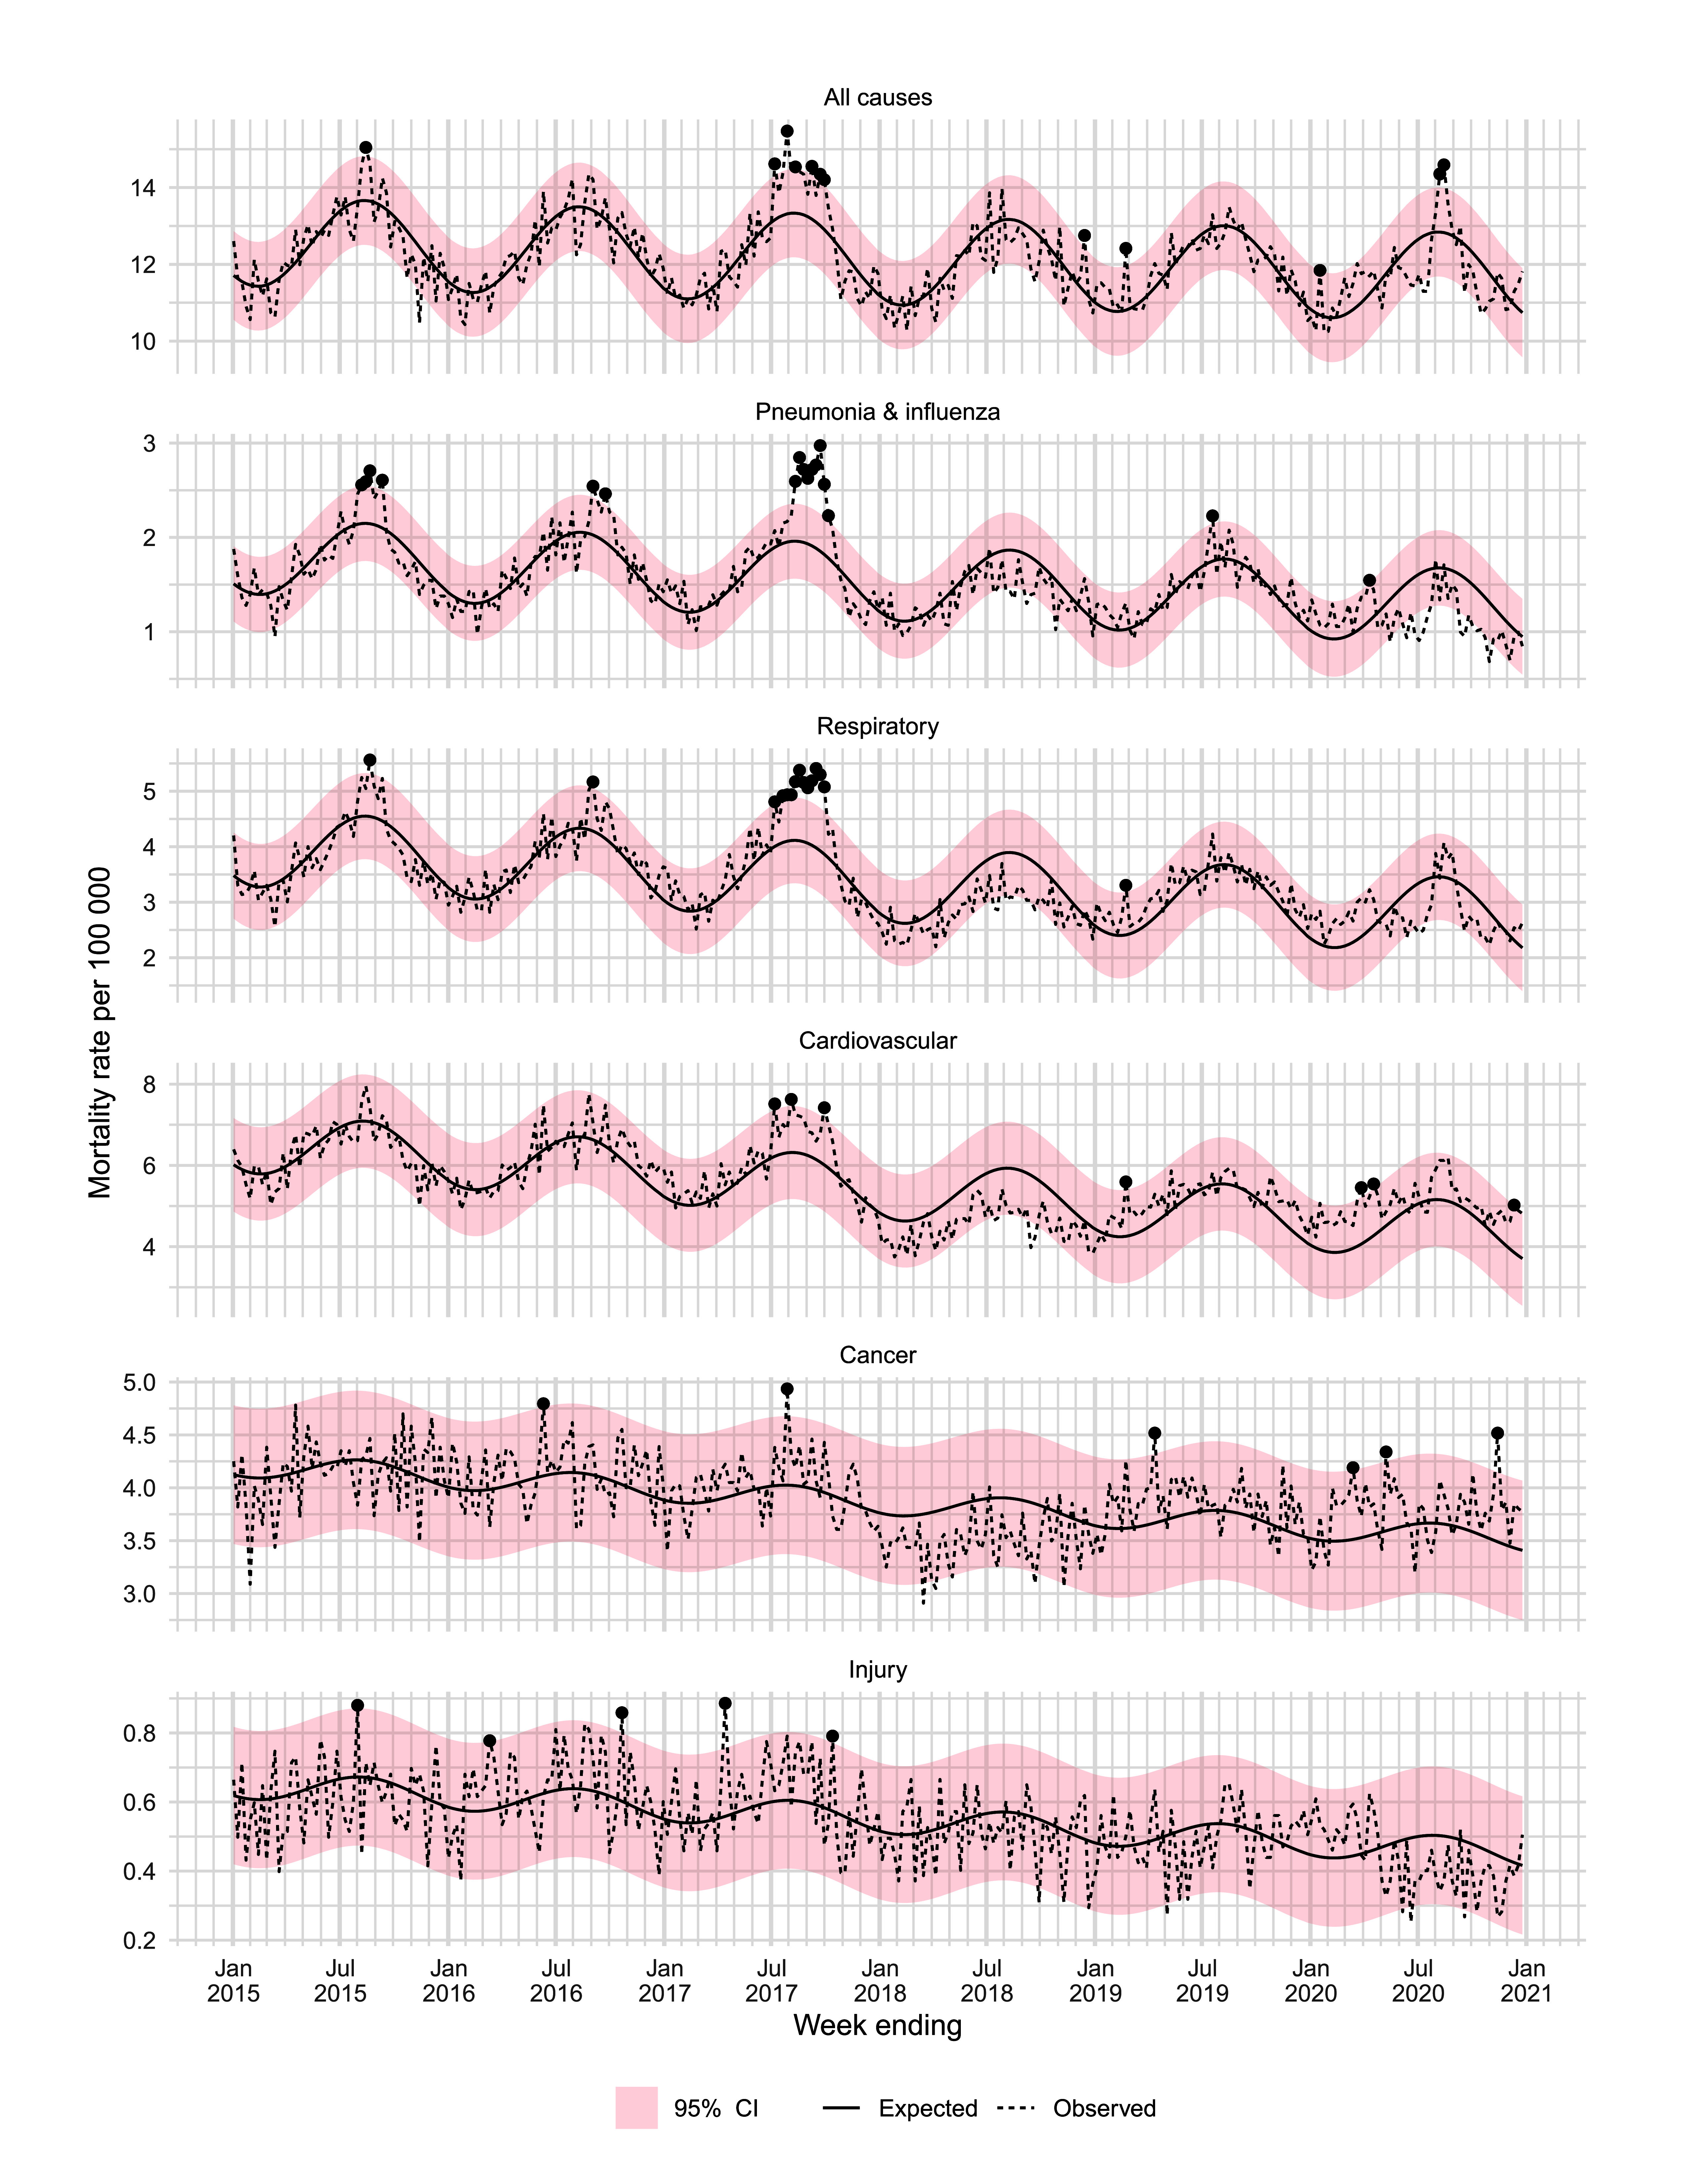
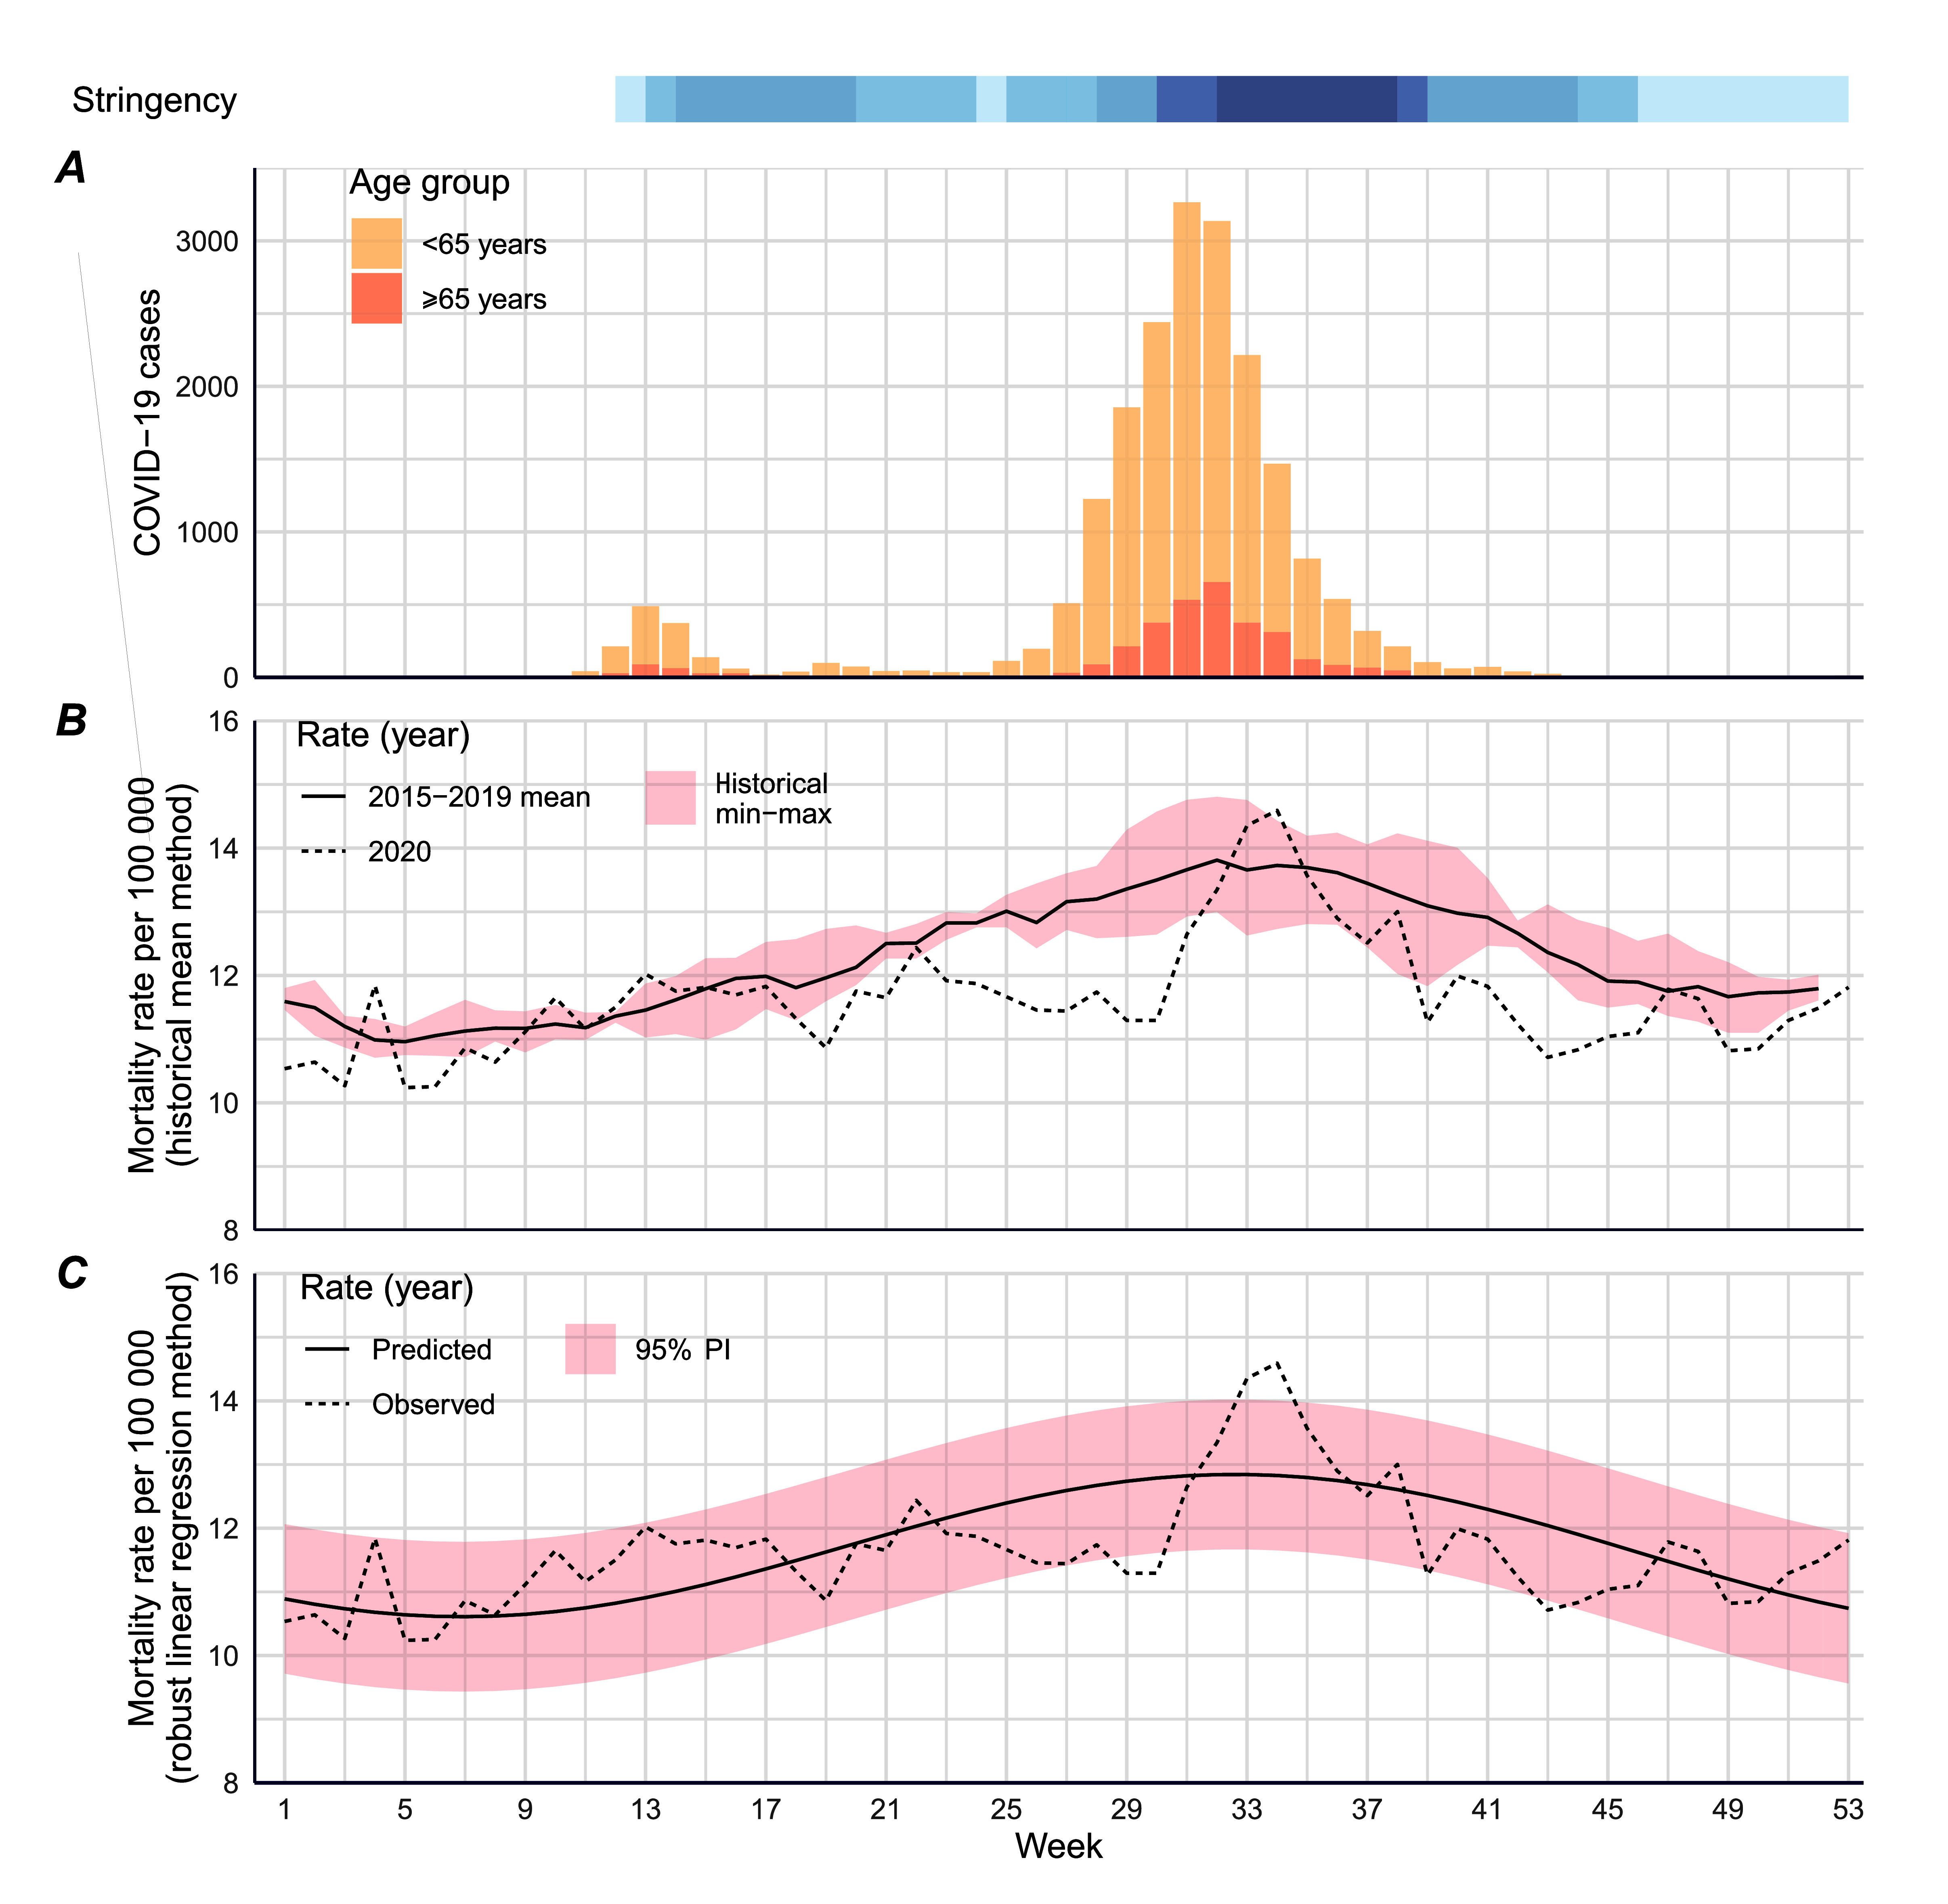
Methods: Registered deaths occurring in Victoria from 1 January 2015 to 31 December 2020 were sourced from the Victoria Death Index. Observed mortality rates were compared to a raw historical 5-year mean and to predicted means estimated from a seasonal robust regression. Differences between the observed mortality rate and the historical mean (∆MR) and excess mortality rate from the observed and predicted rates were assessed.
Results: There were 20 375 COVID-19 cases notified in Victoria as of 31 December 2020, of whom 748 (3.7%) died. Victorians aged ≥ 85 years experienced the highest case fatality ratio (34%). Mean observed mortality rates in 2020 (MR: 11.6; 95% confidence interval [CI]: 11.4, 11.9) were slightly reduced when compared with the annual rate expected using the historical mean method (mean MR: 12.2; 95% CI: 12.1-12.3; ∆MR: -0.57; 95% CI: -0.77, -0.38), but not from the rate expected using the robust regression (estimated MR: 11.7; 95% prediction interval [PI]: 11.5, 11.9; EMR: -0.05; 95% CI: -0.26, 0.16). The two methods yielded opposing interpretations for some causes, including cardiovascular and cancer mortality.
Discussion: Interpretation of how pandemic restrictions impacted mortality in Victoria in 2020 is influenced by the method of estimation. Time-series approaches are preferential because they account for population trends in mortality over time.

 求助内容:
求助内容: 应助结果提醒方式:


