Nickolas Stabellini, Omar M Makram, Harikrishnan Hyma Kunhiraman, Hisham Daoud, John Shanahan, Alberto J Montero, Roger S Blumenthal, Charu Aggarwal, Umang Swami, Salim S Virani, Vanita Noronha, Neeraj Agarwal, Susan Dent, Avirup Guha
{"title":"A novel machine learning-based cancer-specific cardiovascular disease risk score among patients with breast, colorectal, or lung cancer.","authors":"Nickolas Stabellini, Omar M Makram, Harikrishnan Hyma Kunhiraman, Hisham Daoud, John Shanahan, Alberto J Montero, Roger S Blumenthal, Charu Aggarwal, Umang Swami, Salim S Virani, Vanita Noronha, Neeraj Agarwal, Susan Dent, Avirup Guha","doi":"10.1093/jncics/pkaf016","DOIUrl":null,"url":null,"abstract":"<p><strong>Background: </strong>Cancer patients have up to a 3-fold higher risk for cardiovascular disease (CVD) than the general population. Traditional CVD risk scores may be less accurate for them. We aimed to develop cancer-specific CVD risk scores and compare them with conventional scores in predicting 10-year CVD risk for patients with breast cancer (BC), colorectal cancer (CRC), or lung cancer (LC).</p><p><strong>Methods: </strong>We analyzed adults diagnosed with BC, CRC, or LC between 2005 and 2012. An machine learning (ML) Extreme Gradient Boosting algorithm ranked 40-50 covariates for predicting CVD for each cancer type using SHapley Additive exPlanations values. The top 10 ML-predictors were used to create predictive equations using logistic regression and compared with American College of Cardiology (ACC)/American Heart Association (AHA) Pooled Cohort Equations (PCE), Predicting Risk of cardiovascular disease EVENTs (PREVENT), and Systematic COronary Risk Evaluation-2 (SCORE2) using the area under the curve (AUC).</p><p><strong>Results: </strong>We included 10 339 patients: 55.5% had BC, 15.6% had CRC, and 29.7% had LC. The actual 10-year CVD rates were: BC 21%, CRC 10%, and LC 28%. The predictors derived from the ML algorithm included cancer-specific and socioeconomic factors. The cancer-specific predictive scores achieved AUCs of 0.84, 0.76, and 0.83 for BC, CRC, and LC, respectively, and outperformed PCE, PREVENT, and SCORE2, increasing the absolute AUC values by up to 0.31 points (with AUC ranging from 0 to 1). Similar results were found when excluding patients with cardiac history or advanced cancer from the analysis.</p><p><strong>Conclusions: </strong>Cancer-specific CVD predictive scores outperform conventional scores and emphasize the importance of integrating cancer-related covariates for precise prediction.</p>","PeriodicalId":14681,"journal":{"name":"JNCI Cancer Spectrum","volume":" ","pages":""},"PeriodicalIF":4.1000,"publicationDate":"2025-01-03","publicationTypes":"Journal Article","fieldsOfStudy":null,"isOpenAccess":false,"openAccessPdf":"https://www.ncbi.nlm.nih.gov/pmc/articles/PMC11878632/pdf/","citationCount":"0","resultStr":null,"platform":"Semanticscholar","paperid":null,"PeriodicalName":"JNCI Cancer Spectrum","FirstCategoryId":"1085","ListUrlMain":"https://doi.org/10.1093/jncics/pkaf016","RegionNum":0,"RegionCategory":null,"ArticlePicture":[],"TitleCN":null,"AbstractTextCN":null,"PMCID":null,"EPubDate":"","PubModel":"","JCR":"Q2","JCRName":"ONCOLOGY","Score":null,"Total":0}
引用次数: 0
Abstract
Background: Cancer patients have up to a 3-fold higher risk for cardiovascular disease (CVD) than the general population. Traditional CVD risk scores may be less accurate for them. We aimed to develop cancer-specific CVD risk scores and compare them with conventional scores in predicting 10-year CVD risk for patients with breast cancer (BC), colorectal cancer (CRC), or lung cancer (LC).
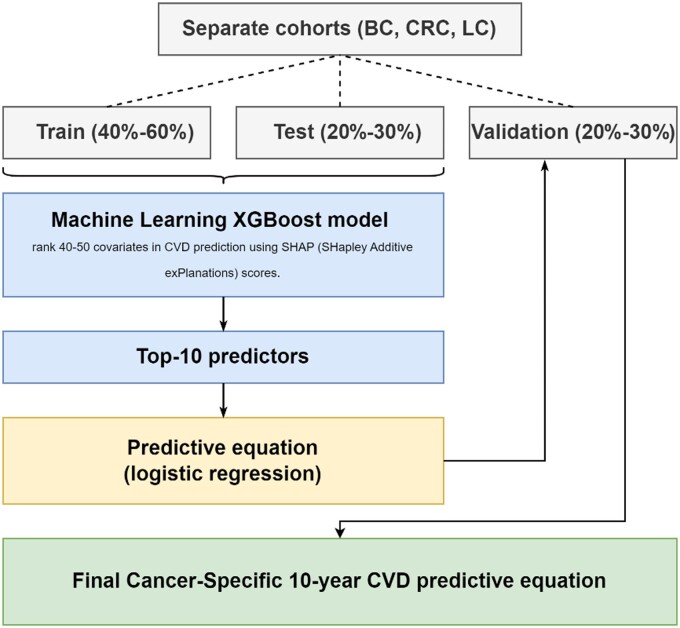
Methods: We analyzed adults diagnosed with BC, CRC, or LC between 2005 and 2012. An machine learning (ML) Extreme Gradient Boosting algorithm ranked 40-50 covariates for predicting CVD for each cancer type using SHapley Additive exPlanations values. The top 10 ML-predictors were used to create predictive equations using logistic regression and compared with American College of Cardiology (ACC)/American Heart Association (AHA) Pooled Cohort Equations (PCE), Predicting Risk of cardiovascular disease EVENTs (PREVENT), and Systematic COronary Risk Evaluation-2 (SCORE2) using the area under the curve (AUC).
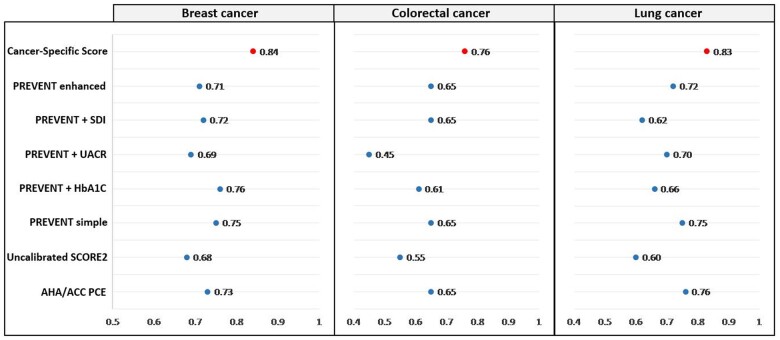
Results: We included 10 339 patients: 55.5% had BC, 15.6% had CRC, and 29.7% had LC. The actual 10-year CVD rates were: BC 21%, CRC 10%, and LC 28%. The predictors derived from the ML algorithm included cancer-specific and socioeconomic factors. The cancer-specific predictive scores achieved AUCs of 0.84, 0.76, and 0.83 for BC, CRC, and LC, respectively, and outperformed PCE, PREVENT, and SCORE2, increasing the absolute AUC values by up to 0.31 points (with AUC ranging from 0 to 1). Similar results were found when excluding patients with cardiac history or advanced cancer from the analysis.
Conclusions: Cancer-specific CVD predictive scores outperform conventional scores and emphasize the importance of integrating cancer-related covariates for precise prediction.

 求助内容:
求助内容: 应助结果提醒方式:


