Ben J Brintz, Darwin J Operario, David Garrett Brown, Shanrui Wu, Lan Wang, Eric R Houpt, Daniel T Leung, Jie Liu, James A Platts-Mills
{"title":"Automated post-run analysis of arrayed quantitative PCR amplification curves using machine learning.","authors":"Ben J Brintz, Darwin J Operario, David Garrett Brown, Shanrui Wu, Lan Wang, Eric R Houpt, Daniel T Leung, Jie Liu, James A Platts-Mills","doi":"10.12688/gatesopenres.16313.1","DOIUrl":null,"url":null,"abstract":"<p><strong>Background: </strong>The TaqMan Array Card (TAC) is an arrayed, high-throughput qPCR platform that can simultaneously detect multiple targets in a single reaction. However, the manual post-run analysis of TAC data is time consuming and subject to interpretation. We sought to automate the post-run analysis of TAC data using machine learning models.</p><p><strong>Methods: </strong>We used 165,214 qPCR amplification curves from two studies to train and test two eXtreme Gradient Boosting (XGBoost) models. Previous manual analyses of the amplification curves by experts in qPCR analysis were used as the gold standard. First, a classification model predicted whether amplification occurred or not, and if so, a second model predicted the cycle threshold (Ct) value. We used 5-fold cross-validation to tune the models and assessed performance using accuracy, sensitivity, specificity, positive predictive value (PPV), negative predictive value (NPV), and mean absolute error (MAE). For external validation, we used 1,472 reactions previously analyzed by 17 laboratory scientists as part of an external quality assessment for a multisite study.</p><p><strong>Results: </strong>In internal validation, the classification model achieved an accuracy of 0.996, sensitivity of 0.997, specificity of 0.993, PPV of 0.998, and NPV of 0.991. The Ct prediction model achieved a MAE of 0.590. In external validation, the automated analysis achieved an accuracy of 0.997 and a MAE of 0.611, and the automated analysis was more accurate than manual analyses by 14 of the 17 laboratory scientists.</p><p><strong>Conclusions: </strong>We automated the post-run analysis of highly-arrayed qPCR data using machine learning models with high accuracy in comparison to a manual gold standard. This approach has the potential to save time and improve reproducibility in laboratories using the TAC platform and other high-throughput qPCR approaches.</p>","PeriodicalId":12593,"journal":{"name":"Gates Open Research","volume":"9 ","pages":"1"},"PeriodicalIF":0.0000,"publicationDate":"2025-01-20","publicationTypes":"Journal Article","fieldsOfStudy":null,"isOpenAccess":false,"openAccessPdf":"https://www.ncbi.nlm.nih.gov/pmc/articles/PMC11756513/pdf/","citationCount":"0","resultStr":null,"platform":"Semanticscholar","paperid":null,"PeriodicalName":"Gates Open Research","FirstCategoryId":"1085","ListUrlMain":"https://doi.org/10.12688/gatesopenres.16313.1","RegionNum":0,"RegionCategory":null,"ArticlePicture":[],"TitleCN":null,"AbstractTextCN":null,"PMCID":null,"EPubDate":"2025/1/1 0:00:00","PubModel":"eCollection","JCR":"","JCRName":"","Score":null,"Total":0}
引用次数: 0
Abstract
Background: The TaqMan Array Card (TAC) is an arrayed, high-throughput qPCR platform that can simultaneously detect multiple targets in a single reaction. However, the manual post-run analysis of TAC data is time consuming and subject to interpretation. We sought to automate the post-run analysis of TAC data using machine learning models.
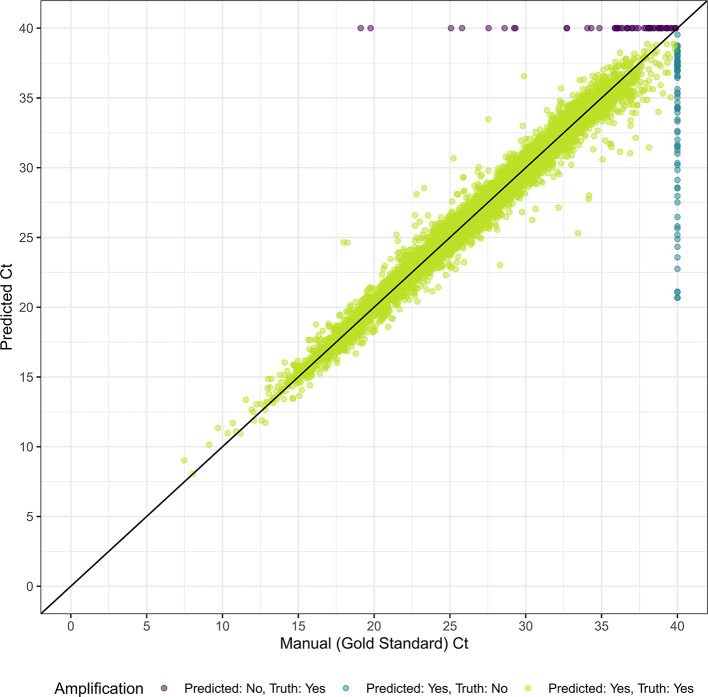
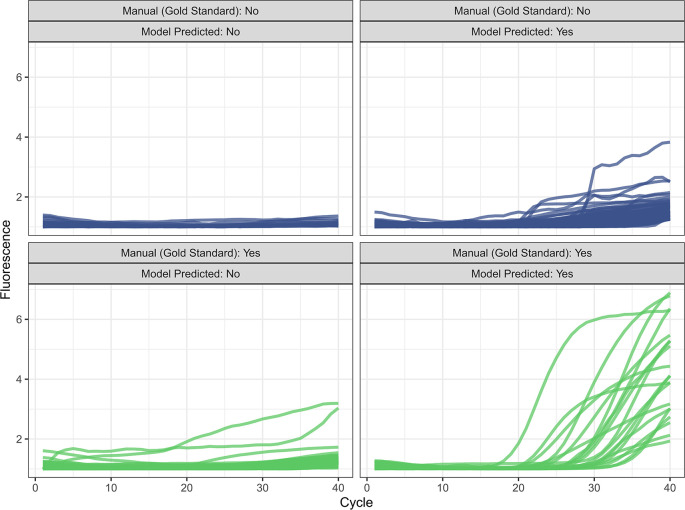
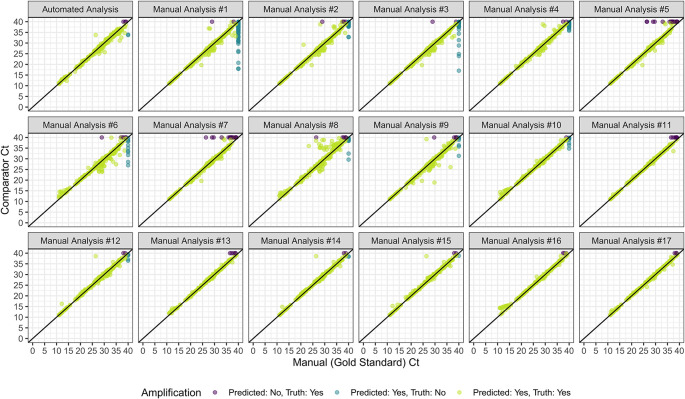
Methods: We used 165,214 qPCR amplification curves from two studies to train and test two eXtreme Gradient Boosting (XGBoost) models. Previous manual analyses of the amplification curves by experts in qPCR analysis were used as the gold standard. First, a classification model predicted whether amplification occurred or not, and if so, a second model predicted the cycle threshold (Ct) value. We used 5-fold cross-validation to tune the models and assessed performance using accuracy, sensitivity, specificity, positive predictive value (PPV), negative predictive value (NPV), and mean absolute error (MAE). For external validation, we used 1,472 reactions previously analyzed by 17 laboratory scientists as part of an external quality assessment for a multisite study.
Results: In internal validation, the classification model achieved an accuracy of 0.996, sensitivity of 0.997, specificity of 0.993, PPV of 0.998, and NPV of 0.991. The Ct prediction model achieved a MAE of 0.590. In external validation, the automated analysis achieved an accuracy of 0.997 and a MAE of 0.611, and the automated analysis was more accurate than manual analyses by 14 of the 17 laboratory scientists.
Conclusions: We automated the post-run analysis of highly-arrayed qPCR data using machine learning models with high accuracy in comparison to a manual gold standard. This approach has the potential to save time and improve reproducibility in laboratories using the TAC platform and other high-throughput qPCR approaches.

 求助内容:
求助内容: 应助结果提醒方式:


