TGV: suite of tools to visualize transmission graphs.
IF 2.8
Q1 GENETICS & HEREDITY
NAR Genomics and Bioinformatics
Pub Date : 2024-12-05
eCollection Date: 2024-12-01
DOI:10.1093/nargab/lqae158
引用次数: 0
Abstract
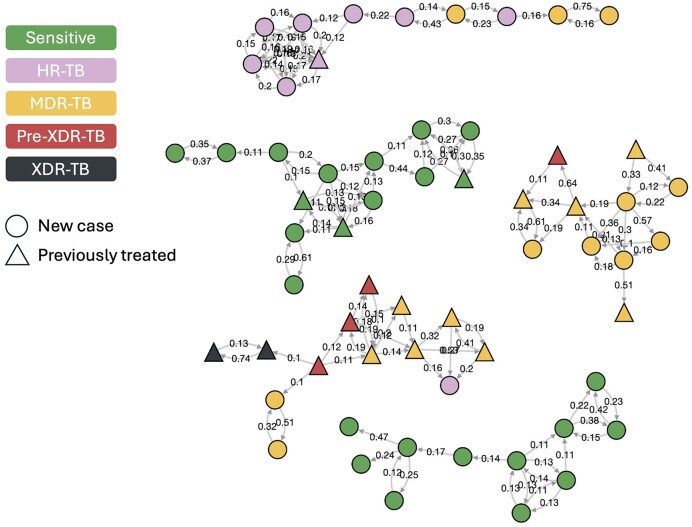
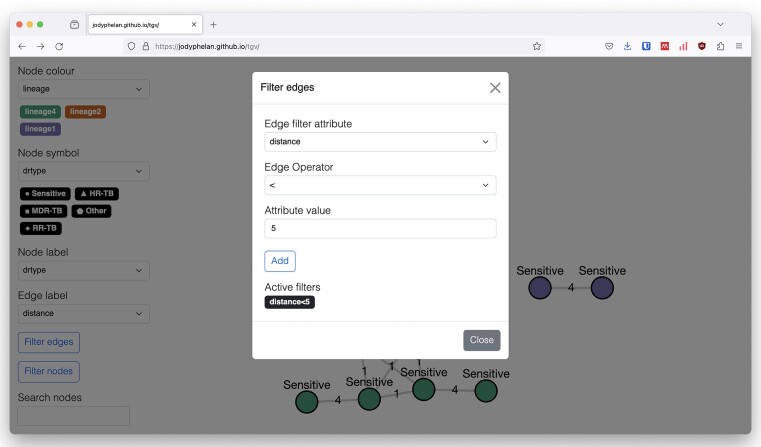
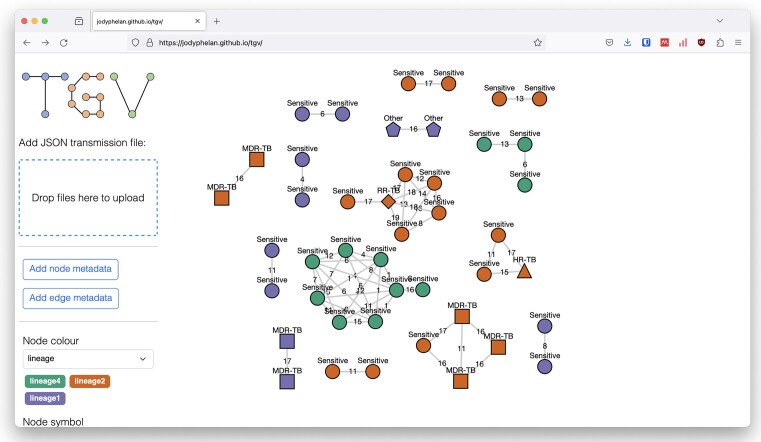
Graph structures are often used to visualize transmission networks generated using genomic epidemiological methods. However, tools to interactively visualize these graphs do not exist. A browser-based tool allowing users to load and interactively visualize transmission graphs was developed in JavaScript. Associated metadata can be loaded and used to annotate and filter the nodes and edges of transmission networks. The tool is available at jodyphelan.github.io/tgv.
TGV:可视化传输图的工具套件。
图形结构通常用于可视化使用基因组流行病学方法生成的传播网络。然而,还不存在以交互方式可视化这些图表的工具。一个基于浏览器的工具,允许用户加载和交互可视化传输图是用JavaScript开发的。可以加载相关的元数据,用于对传输网络的节点和边缘进行注释和过滤。该工具可在jodyphelan.github.io/tgv获得。
本文章由计算机程序翻译,如有差异,请以英文原文为准。
求助全文
约1分钟内获得全文
求助全文

 求助内容:
求助内容: 应助结果提醒方式:


