Nasibeh Zanjirani Farahani PhD , Mateo Alzate Aguirre MD , Vanessa Karlinski Vizentin MD , Moein Enayati PhD , J. Martijn Bos MD, PhD , Andredi Pumarejo Medina MD , Kathryn F. Larson MD , Kalyan S. Pasupathy PhD , Christopher G. Scott MS , April L. Zacher MS , Eduard Schlechtinger MS , Bruce K. Daniels RDCS , Vinod C. Kaggal MS , Jeffrey B. Geske MD , Patricia A. Pellikka MD , Jae K. Oh MD , Steve R. Ommen MD , Garvan C. Kane MD , Michael J. Ackerman MD, PhD , Adelaide M. Arruda-Olson MD, PhD
{"title":"Echocardiographic Diagnosis of Hypertrophic Cardiomyopathy by Machine Learning","authors":"Nasibeh Zanjirani Farahani PhD , Mateo Alzate Aguirre MD , Vanessa Karlinski Vizentin MD , Moein Enayati PhD , J. Martijn Bos MD, PhD , Andredi Pumarejo Medina MD , Kathryn F. Larson MD , Kalyan S. Pasupathy PhD , Christopher G. Scott MS , April L. Zacher MS , Eduard Schlechtinger MS , Bruce K. Daniels RDCS , Vinod C. Kaggal MS , Jeffrey B. Geske MD , Patricia A. Pellikka MD , Jae K. Oh MD , Steve R. Ommen MD , Garvan C. Kane MD , Michael J. Ackerman MD, PhD , Adelaide M. Arruda-Olson MD, PhD","doi":"10.1016/j.mcpdig.2024.08.009","DOIUrl":null,"url":null,"abstract":"<div><h3>Objective</h3><div>To develop machine learning tools for automated hypertrophic cardiomyopathy (HCM) case recognition from echocardiographic metrics, aiming to identify HCM from standard echocardiographic data with high performance.</div></div><div><h3>Patients and Methods</h3><div>Four different random forest machine learning models were developed using a case-control cohort composed of 5548 patients with HCM and 16,973 controls without HCM, from January 1, 2004, to March 15, 2019. Each patient with HCM was matched to 3 controls by sex, age, and year of echocardiography. Ten-fold crossvalidation was used to train the models to identify HCM. Variables included in the models were demographic characteristics (age, sex, and body surface area) and 16 standard echocardiographic metrics.</div></div><div><h3>Results</h3><div>The models were differentiated by global, average, individual, or no strain measurements. Area under the receiver operating characteristic curves (area under the curve) ranged from 0.92 to 0.98 for the 4 separate models. Area under the curves of model 2 (using left ventricular global longitudinal strain; 0.97; 95% CI, 0.95-0.98), 3 (using averaged strain; 0.96; 95% CI, 0.94-0.97), and 4 (using 17 individual strains per patient; 0.98; 95% CI, 0.97-0.99) had comparable performance. By comparison, model 1 (no strain data; 0.92; 95% CI, 0.90-0.94) had an inferior area under the curve.</div></div><div><h3>Conclusion</h3><div>Machine learning tools that analyze echocardiographic metrics identified HCM cases with high performance. Detection of HCM cases improved when strain data was combined with standard echocardiographic metrics.</div></div>","PeriodicalId":74127,"journal":{"name":"Mayo Clinic Proceedings. Digital health","volume":"2 4","pages":"Pages 564-573"},"PeriodicalIF":0.0000,"publicationDate":"2024-09-03","publicationTypes":"Journal Article","fieldsOfStudy":null,"isOpenAccess":false,"openAccessPdf":"","citationCount":"0","resultStr":null,"platform":"Semanticscholar","paperid":null,"PeriodicalName":"Mayo Clinic Proceedings. Digital health","FirstCategoryId":"1085","ListUrlMain":"https://www.sciencedirect.com/science/article/pii/S2949761224000841","RegionNum":0,"RegionCategory":null,"ArticlePicture":[],"TitleCN":null,"AbstractTextCN":null,"PMCID":null,"EPubDate":"","PubModel":"","JCR":"","JCRName":"","Score":null,"Total":0}
引用次数: 0
Abstract
Objective
To develop machine learning tools for automated hypertrophic cardiomyopathy (HCM) case recognition from echocardiographic metrics, aiming to identify HCM from standard echocardiographic data with high performance.
Patients and Methods
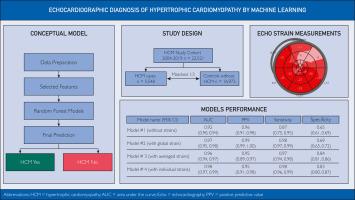
Four different random forest machine learning models were developed using a case-control cohort composed of 5548 patients with HCM and 16,973 controls without HCM, from January 1, 2004, to March 15, 2019. Each patient with HCM was matched to 3 controls by sex, age, and year of echocardiography. Ten-fold crossvalidation was used to train the models to identify HCM. Variables included in the models were demographic characteristics (age, sex, and body surface area) and 16 standard echocardiographic metrics.
Results
The models were differentiated by global, average, individual, or no strain measurements. Area under the receiver operating characteristic curves (area under the curve) ranged from 0.92 to 0.98 for the 4 separate models. Area under the curves of model 2 (using left ventricular global longitudinal strain; 0.97; 95% CI, 0.95-0.98), 3 (using averaged strain; 0.96; 95% CI, 0.94-0.97), and 4 (using 17 individual strains per patient; 0.98; 95% CI, 0.97-0.99) had comparable performance. By comparison, model 1 (no strain data; 0.92; 95% CI, 0.90-0.94) had an inferior area under the curve.
Conclusion
Machine learning tools that analyze echocardiographic metrics identified HCM cases with high performance. Detection of HCM cases improved when strain data was combined with standard echocardiographic metrics.