Britt W. Smith, Christopher E. Soulard, Jessica J. Walker
{"title":"Crop type classification, trends, and patterns of central California agricultural fields from 2005 to 2020","authors":"Britt W. Smith, Christopher E. Soulard, Jessica J. Walker","doi":"10.1002/agg2.20553","DOIUrl":null,"url":null,"abstract":"<p>California produces many key agricultural products in the United States. Current geospatial agricultural datasets are limited in mapping accuracy, spatial context, or observation period. This study uses machine learning and high-resolution imagery to produce a time series of crop maps to assess crop type trends and patterns across central California from 2005 to 2020. National Agriculture Imagery Program and Landsat imagery were used to classify nine crop types that are common in the study region: grain crops, field crops, rice, citrus and subtropical, deciduous fruit and nut, vineyard, berry and vegetable, pasture, and fallow/young perennial crop types. To create labeled data, we sampled 1253 fields and manually identified crop types for each examined year using high-resolution imagery and Landsat normalized difference vegetation index time series. We applied a random forest machine learning algorithm in Google Earth Engine. Results show that the mean overall classification accuracy of the nine-class map was 93.1%, with individual accuracies ranging from 99.3% (rice) to 89.5% (fallow/young perennial). Mann–Kendall trend tests showed significant (<i>p</i> < 0.05) declines in field crop and pasture area during the study period, while deciduous fruit and nut, citrus and subtropical, and fallow/young perennial crop types experienced significant increases. At an aggregate level, there was a general shift from annual crop types to perennial crop types. These data provide a 16-year time span of spatially explicit crop type classifications, trends, and patterns in central California that can be used to aid managers and decision makers for resource planning or hazard mitigation.</p>","PeriodicalId":7567,"journal":{"name":"Agrosystems, Geosciences & Environment","volume":"7 3","pages":""},"PeriodicalIF":1.3000,"publicationDate":"2024-07-25","publicationTypes":"Journal Article","fieldsOfStudy":null,"isOpenAccess":false,"openAccessPdf":"https://onlinelibrary.wiley.com/doi/epdf/10.1002/agg2.20553","citationCount":"0","resultStr":null,"platform":"Semanticscholar","paperid":null,"PeriodicalName":"Agrosystems, Geosciences & Environment","FirstCategoryId":"1085","ListUrlMain":"https://onlinelibrary.wiley.com/doi/10.1002/agg2.20553","RegionNum":0,"RegionCategory":null,"ArticlePicture":[],"TitleCN":null,"AbstractTextCN":null,"PMCID":null,"EPubDate":"","PubModel":"","JCR":"Q3","JCRName":"AGRONOMY","Score":null,"Total":0}
引用次数: 0
Abstract
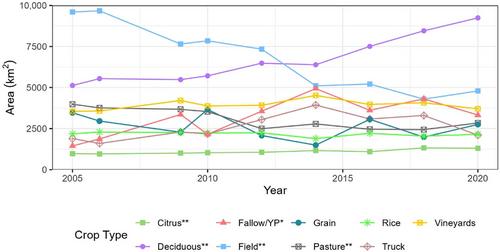
California produces many key agricultural products in the United States. Current geospatial agricultural datasets are limited in mapping accuracy, spatial context, or observation period. This study uses machine learning and high-resolution imagery to produce a time series of crop maps to assess crop type trends and patterns across central California from 2005 to 2020. National Agriculture Imagery Program and Landsat imagery were used to classify nine crop types that are common in the study region: grain crops, field crops, rice, citrus and subtropical, deciduous fruit and nut, vineyard, berry and vegetable, pasture, and fallow/young perennial crop types. To create labeled data, we sampled 1253 fields and manually identified crop types for each examined year using high-resolution imagery and Landsat normalized difference vegetation index time series. We applied a random forest machine learning algorithm in Google Earth Engine. Results show that the mean overall classification accuracy of the nine-class map was 93.1%, with individual accuracies ranging from 99.3% (rice) to 89.5% (fallow/young perennial). Mann–Kendall trend tests showed significant (p < 0.05) declines in field crop and pasture area during the study period, while deciduous fruit and nut, citrus and subtropical, and fallow/young perennial crop types experienced significant increases. At an aggregate level, there was a general shift from annual crop types to perennial crop types. These data provide a 16-year time span of spatially explicit crop type classifications, trends, and patterns in central California that can be used to aid managers and decision makers for resource planning or hazard mitigation.

 求助内容:
求助内容: 应助结果提醒方式:


