Maarja Pajusalu, Kerli Mooses, Marek Oja, Sirli Tamm, Markus Haug, Raivo Kolde
{"title":"TrajectoryViz: Interactive visualization of treatment trajectories","authors":"Maarja Pajusalu, Kerli Mooses, Marek Oja, Sirli Tamm, Markus Haug, Raivo Kolde","doi":"10.1016/j.imu.2024.101558","DOIUrl":null,"url":null,"abstract":"<div><h3>Background and objectives</h3><p>With the proliferation of real-world or observational health data, there is increasing interest in studying treatment trajectories. The real-life treatment trajectories can be complex, and one has to simplify the patterns to draw any conclusions; however, oversimplification will cause the loss of essential details. Thus, the visualization challenge is to strike a balance between the two extremes.</p></div><div><h3>Methods</h3><p>We have implemented the observation of treatment trajectories starting from cohort definitions in cooperation with medical specialists, data processing, and then generating the interactive visualizations and detailed data tables derived from input data within an open-source R package as a Shiny dashboard. The created R package called TrajectoryViz (<span><span>https://github.com/HealthInformaticsUT/TrajectoryViz</span><svg><path></path></svg></span>) enables reproducible visual analysis and visual content generation for various data investigations and explanations.</p></div><div><h3>Results</h3><p>We illustrate the use of the tool by assessing the sequence of events present within the data of cervical cancer prevention pathways, as well as the proportions of timely follow-up procedure events.</p></div><div><h3>Conclusion</h3><p>Building a toolset to access, manage, and analyze observational health data enables more accessible visual analysis of complicated data, adding time dimension to otherwise simplified event sequences that make up trajectories.</p></div>","PeriodicalId":13953,"journal":{"name":"Informatics in Medicine Unlocked","volume":"49 ","pages":"Article 101558"},"PeriodicalIF":0.0000,"publicationDate":"2024-01-01","publicationTypes":"Journal Article","fieldsOfStudy":null,"isOpenAccess":false,"openAccessPdf":"https://www.sciencedirect.com/science/article/pii/S235291482400114X/pdfft?md5=0894191c372d2fc40671b6cd74491d0e&pid=1-s2.0-S235291482400114X-main.pdf","citationCount":"0","resultStr":null,"platform":"Semanticscholar","paperid":null,"PeriodicalName":"Informatics in Medicine Unlocked","FirstCategoryId":"1085","ListUrlMain":"https://www.sciencedirect.com/science/article/pii/S235291482400114X","RegionNum":0,"RegionCategory":null,"ArticlePicture":[],"TitleCN":null,"AbstractTextCN":null,"PMCID":null,"EPubDate":"","PubModel":"","JCR":"Q1","JCRName":"Medicine","Score":null,"Total":0}
引用次数: 0
Abstract
Background and objectives
With the proliferation of real-world or observational health data, there is increasing interest in studying treatment trajectories. The real-life treatment trajectories can be complex, and one has to simplify the patterns to draw any conclusions; however, oversimplification will cause the loss of essential details. Thus, the visualization challenge is to strike a balance between the two extremes.
Methods
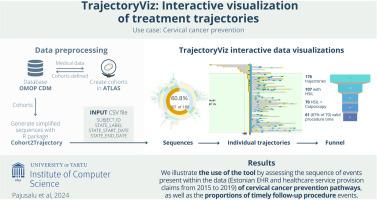
We have implemented the observation of treatment trajectories starting from cohort definitions in cooperation with medical specialists, data processing, and then generating the interactive visualizations and detailed data tables derived from input data within an open-source R package as a Shiny dashboard. The created R package called TrajectoryViz (https://github.com/HealthInformaticsUT/TrajectoryViz) enables reproducible visual analysis and visual content generation for various data investigations and explanations.
Results
We illustrate the use of the tool by assessing the sequence of events present within the data of cervical cancer prevention pathways, as well as the proportions of timely follow-up procedure events.
Conclusion
Building a toolset to access, manage, and analyze observational health data enables more accessible visual analysis of complicated data, adding time dimension to otherwise simplified event sequences that make up trajectories.
背景和目的随着真实世界或观察性健康数据的激增,人们对治疗轨迹的研究越来越感兴趣。现实生活中的治疗轨迹可能很复杂,人们必须简化其模式才能得出结论;但是,过度简化又会导致基本细节的丢失。因此,可视化的挑战在于如何在这两个极端之间取得平衡。方法我们与医学专家合作,从队列定义、数据处理开始,对治疗轨迹进行观察,然后在一个开源的 R 软件包中以 Shiny dashboard 的形式生成从输入数据中提取的交互式可视化和详细数据表。创建的 R 软件包名为 TrajectoryViz (https://github.com/HealthInformaticsUT/TrajectoryViz),可以为各种数据调查和解释提供可重复的可视化分析和可视化内容生成。结果我们通过评估宫颈癌预防路径数据中存在的事件序列以及及时随访程序事件的比例,说明了该工具的使用情况。结论建立一个工具集来访问、管理和分析观察性健康数据,可以更方便地对复杂数据进行可视化分析,为构成轨迹的简化事件序列增加时间维度。
期刊介绍:
Informatics in Medicine Unlocked (IMU) is an international gold open access journal covering a broad spectrum of topics within medical informatics, including (but not limited to) papers focusing on imaging, pathology, teledermatology, public health, ophthalmological, nursing and translational medicine informatics. The full papers that are published in the journal are accessible to all who visit the website.

 求助内容:
求助内容: 应助结果提醒方式:


