Stephen D. Dertinger, Erica Briggs, Yusuf Hussien, Steven M. Bryce, Svetlana L. Avlasevich, Adam Conrad, George E. Johnson, Andrew Williams, Jeffrey C. Bemis
{"title":"Visualization strategies to aid interpretation of high-dimensional genotoxicity data","authors":"Stephen D. Dertinger, Erica Briggs, Yusuf Hussien, Steven M. Bryce, Svetlana L. Avlasevich, Adam Conrad, George E. Johnson, Andrew Williams, Jeffrey C. Bemis","doi":"10.1002/em.22604","DOIUrl":null,"url":null,"abstract":"<p>This article describes a range of high-dimensional data visualization strategies that we have explored for their ability to complement machine learning algorithm predictions derived from MultiFlow® assay results. For this exercise, we focused on seven biomarker responses resulting from the exposure of TK6 cells to each of 126 diverse chemicals over a range of concentrations. Obviously, challenges associated with visualizing seven biomarker responses were further complicated whenever there was a desire to represent the entire 126 chemical data set as opposed to results from a single chemical. Scatter plots, spider plots, parallel coordinate plots, hierarchical clustering, principal component analysis, toxicological prioritization index, multidimensional scaling, t-distributed stochastic neighbor embedding, and uniform manifold approximation and projection are each considered in turn. Our report provides a comparative analysis of these techniques. In an era where multiplexed assays and machine learning algorithms are becoming the norm, stakeholders should find some of these visualization strategies useful for efficiently and effectively interpreting their high-dimensional data.</p>","PeriodicalId":11791,"journal":{"name":"Environmental and Molecular Mutagenesis","volume":"65 5","pages":"156-178"},"PeriodicalIF":2.3000,"publicationDate":"2024-05-17","publicationTypes":"Journal Article","fieldsOfStudy":null,"isOpenAccess":false,"openAccessPdf":"https://onlinelibrary.wiley.com/doi/epdf/10.1002/em.22604","citationCount":"0","resultStr":null,"platform":"Semanticscholar","paperid":null,"PeriodicalName":"Environmental and Molecular Mutagenesis","FirstCategoryId":"93","ListUrlMain":"https://onlinelibrary.wiley.com/doi/10.1002/em.22604","RegionNum":4,"RegionCategory":"医学","ArticlePicture":[],"TitleCN":null,"AbstractTextCN":null,"PMCID":null,"EPubDate":"","PubModel":"","JCR":"Q3","JCRName":"ENVIRONMENTAL SCIENCES","Score":null,"Total":0}
引用次数: 0
Abstract
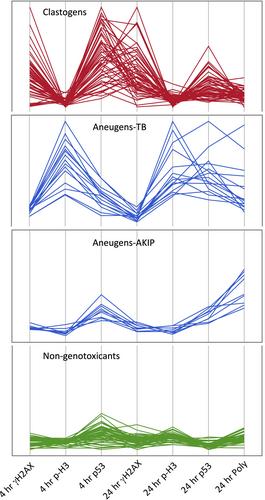
This article describes a range of high-dimensional data visualization strategies that we have explored for their ability to complement machine learning algorithm predictions derived from MultiFlow® assay results. For this exercise, we focused on seven biomarker responses resulting from the exposure of TK6 cells to each of 126 diverse chemicals over a range of concentrations. Obviously, challenges associated with visualizing seven biomarker responses were further complicated whenever there was a desire to represent the entire 126 chemical data set as opposed to results from a single chemical. Scatter plots, spider plots, parallel coordinate plots, hierarchical clustering, principal component analysis, toxicological prioritization index, multidimensional scaling, t-distributed stochastic neighbor embedding, and uniform manifold approximation and projection are each considered in turn. Our report provides a comparative analysis of these techniques. In an era where multiplexed assays and machine learning algorithms are becoming the norm, stakeholders should find some of these visualization strategies useful for efficiently and effectively interpreting their high-dimensional data.
期刊介绍:
Environmental and Molecular Mutagenesis publishes original research manuscripts, reviews and commentaries on topics related to six general areas, with an emphasis on subject matter most suited for the readership of EMM as outlined below. The journal is intended for investigators in fields such as molecular biology, biochemistry, microbiology, genetics and epigenetics, genomics and epigenomics, cancer research, neurobiology, heritable mutation, radiation biology, toxicology, and molecular & environmental epidemiology.
 求助内容:
求助内容: 应助结果提醒方式:


