Sylvia S. Nyawira, Martin Herold, Kalkidan Ayele Mulatu, Rosa Maria Roman-Cuesta, Richard A. Houghton, Giacomo Grassi, Julia Pongratz, Thomas Gasser, Louis Verchot
{"title":"Pantropical CO2 emissions and removals for the AFOLU sector in the period 1990–2018","authors":"Sylvia S. Nyawira, Martin Herold, Kalkidan Ayele Mulatu, Rosa Maria Roman-Cuesta, Richard A. Houghton, Giacomo Grassi, Julia Pongratz, Thomas Gasser, Louis Verchot","doi":"10.1007/s11027-023-10096-z","DOIUrl":null,"url":null,"abstract":"<p>Transparent, accurate, comparable, and complete estimates of greenhouse gas emissions and removals are needed to support mitigation goals and performance assessments under the Paris Agreement. Here, we present a comparative analysis of the agriculture forestry and other land use (AFOLU) emission estimates from different datasets, including National Greenhouse Gas Inventories (NGHGIs), FAOSTAT, the BLUE, OSCAR, and Houghton (here after updated H&N2017) bookkeeping models; Emissions Database for Global Atmospheric Research (EDGAR); and the US Environmental Protection Agency (EPA). We disaggregate the fluxes for the forestry and other land use (FOLU) sector into forest land, deforestation, and other land uses (including non-forest land uses), while agricultural emissions are disaggregated according to the sources (i.e., livestock, croplands, rice cultivation, and agricultural fires). Considering different time periods (1990–1999, 2000–2010, and 2011–2018), we analyse the trend of the fluxes with a key focus on the tropical regions (i.e., Latin America, sub-Saharan Africa, and South and Southeast Asia). Three of the five data sources indicated a decline in the net emissions over the tropics over the period 1990–2018. The net FOLU emissions for the tropics varied with values of 5.47, 5.22, 4.28, 3.21, and 1.17 GtCO<sub>2</sub> year<sup>−1</sup> (for BLUE, OSCAR, updated H&N2017, FAOSTAT, and NGHGIs, respectively) over the recent period (2011–2018). Gross deforestation emissions over the same period were 5.87, 7.16, 5.48, 3.96, and 3.74 GtCO<sub>2</sub> year<sup>−1</sup> (for BLUE, OSCAR, updated H&N2017, FAOSTAT, and NGHGIs). The net forestland sink was −1.97, −3.08, −2.09, −0.53, and −3.00 GtCO<sub>2</sub> year<sup>−1</sup> (for BLUE, OSCAR, updated H&N2017, FAOSTAT, and NGHGIs). Continental analysis indicated that the differences between the data sources are much large in sub-Saharan Africa and South and Southeast Asia than in Latin America. Disagreements in the FOLU emission estimates are mainly explained by differences in the managed land areas and the processes considered (i.e., direct vs indirect effects of land use change, and gross vs net accounting for deforestation). Net agricultural emissions from cropland, livestock, and rice cultivation were more homogenous across the FAOSTAT, EDGAR, and EPA datasets, with all the data sources indicating an increase in the emissions over the tropics. However, there were notable differences in the emission from agricultural fires. This study highlights the importance of investing and improving data sources for key fluxes to achieve a more robust and transparent global stocktake.</p>","PeriodicalId":54387,"journal":{"name":"Mitigation and Adaptation Strategies for Global Change","volume":"61 1","pages":""},"PeriodicalIF":2.7000,"publicationDate":"2024-02-20","publicationTypes":"Journal Article","fieldsOfStudy":null,"isOpenAccess":false,"openAccessPdf":"","citationCount":"0","resultStr":null,"platform":"Semanticscholar","paperid":null,"PeriodicalName":"Mitigation and Adaptation Strategies for Global Change","FirstCategoryId":"93","ListUrlMain":"https://doi.org/10.1007/s11027-023-10096-z","RegionNum":3,"RegionCategory":"环境科学与生态学","ArticlePicture":[],"TitleCN":null,"AbstractTextCN":null,"PMCID":null,"EPubDate":"","PubModel":"","JCR":"Q3","JCRName":"ENVIRONMENTAL SCIENCES","Score":null,"Total":0}
引用次数: 0
Abstract
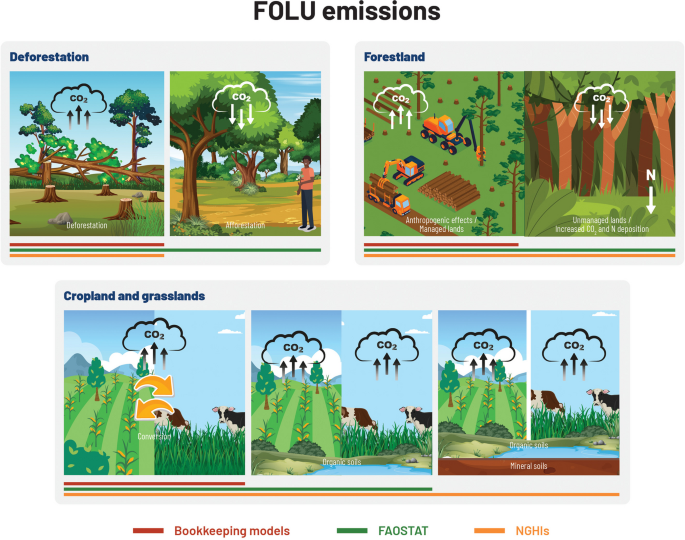
Transparent, accurate, comparable, and complete estimates of greenhouse gas emissions and removals are needed to support mitigation goals and performance assessments under the Paris Agreement. Here, we present a comparative analysis of the agriculture forestry and other land use (AFOLU) emission estimates from different datasets, including National Greenhouse Gas Inventories (NGHGIs), FAOSTAT, the BLUE, OSCAR, and Houghton (here after updated H&N2017) bookkeeping models; Emissions Database for Global Atmospheric Research (EDGAR); and the US Environmental Protection Agency (EPA). We disaggregate the fluxes for the forestry and other land use (FOLU) sector into forest land, deforestation, and other land uses (including non-forest land uses), while agricultural emissions are disaggregated according to the sources (i.e., livestock, croplands, rice cultivation, and agricultural fires). Considering different time periods (1990–1999, 2000–2010, and 2011–2018), we analyse the trend of the fluxes with a key focus on the tropical regions (i.e., Latin America, sub-Saharan Africa, and South and Southeast Asia). Three of the five data sources indicated a decline in the net emissions over the tropics over the period 1990–2018. The net FOLU emissions for the tropics varied with values of 5.47, 5.22, 4.28, 3.21, and 1.17 GtCO2 year−1 (for BLUE, OSCAR, updated H&N2017, FAOSTAT, and NGHGIs, respectively) over the recent period (2011–2018). Gross deforestation emissions over the same period were 5.87, 7.16, 5.48, 3.96, and 3.74 GtCO2 year−1 (for BLUE, OSCAR, updated H&N2017, FAOSTAT, and NGHGIs). The net forestland sink was −1.97, −3.08, −2.09, −0.53, and −3.00 GtCO2 year−1 (for BLUE, OSCAR, updated H&N2017, FAOSTAT, and NGHGIs). Continental analysis indicated that the differences between the data sources are much large in sub-Saharan Africa and South and Southeast Asia than in Latin America. Disagreements in the FOLU emission estimates are mainly explained by differences in the managed land areas and the processes considered (i.e., direct vs indirect effects of land use change, and gross vs net accounting for deforestation). Net agricultural emissions from cropland, livestock, and rice cultivation were more homogenous across the FAOSTAT, EDGAR, and EPA datasets, with all the data sources indicating an increase in the emissions over the tropics. However, there were notable differences in the emission from agricultural fires. This study highlights the importance of investing and improving data sources for key fluxes to achieve a more robust and transparent global stocktake.
期刊介绍:
The Earth''s biosphere is being transformed by various anthropogenic activities. Mitigation and Adaptation Strategies for Global Change addresses a wide range of environment, economic and energy topics and timely issues including global climate change, stratospheric ozone depletion, acid deposition, eutrophication of terrestrial and aquatic ecosystems, species extinction and loss of biological diversity, deforestation and forest degradation, desertification, soil resource degradation, land-use change, sea level rise, destruction of coastal zones, depletion of fresh water and marine fisheries, loss of wetlands and riparian zones and hazardous waste management.
Response options to mitigate these threats or to adapt to changing environs are needed to ensure a sustainable biosphere for all forms of life. To that end, Mitigation and Adaptation Strategies for Global Change provides a forum to encourage the conceptualization, critical examination and debate regarding response options. The aim of this journal is to provide a forum to review, analyze and stimulate the development, testing and implementation of mitigation and adaptation strategies at regional, national and global scales. One of the primary goals of this journal is to contribute to real-time policy analysis and development as national and international policies and agreements are discussed and promulgated.
 求助内容:
求助内容: 应助结果提醒方式:


