{"title":"Capacity degradation analysis and knee point prediction for lithium-ion batteries","authors":"","doi":"10.1016/j.geits.2024.100171","DOIUrl":null,"url":null,"abstract":"<div><p>Analyzing capacity degradation characteristics and accurately predicting the knee point of capacity are crucial for the safety management of lithium-ion batteries (LIBs). However, the degradation mechanism of LIBs is complex. A key but challenging problem is how to clarify the degradation mechanism and predict the knee point. According to the external characteristics such as capacity decline gradievnt and the peak value of increment capacity curve (IC curve), the capacity degradation can be divided into four stages, including initial decline stage, slow decline stage, transition stage and high-speed decline stage. The degradation mechanism of LIBs is compared from the longitudinal and horizontal aspects, respectively. Among them, the battery usage from the initial stage to the end of life (EOL) is longitudinal analysis. The battery under different conditions, such as charging and discharging, different discharge rate, different cathode material degradation mechanism is horizontal analysis. Moreover, a method based on neural network is proposed to predict the knee point. Two features are used to predict the capacity and cycle of the knee point, which are the gradient of the capacity degradation curve and the difference of the IC curve with the maximum correlation. The experimental results show that a two-dimensional surface can be obtained using only the first 100 cycles, which can provide a reference for the position of the knee point accurately prediction.</p></div>","PeriodicalId":100596,"journal":{"name":"Green Energy and Intelligent Transportation","volume":"3 5","pages":"Article 100171"},"PeriodicalIF":16.4000,"publicationDate":"2024-01-11","publicationTypes":"Journal Article","fieldsOfStudy":null,"isOpenAccess":false,"openAccessPdf":"https://www.sciencedirect.com/science/article/pii/S2773153724000239/pdfft?md5=899d33fc9697174f1f74aed781dbfb61&pid=1-s2.0-S2773153724000239-main.pdf","citationCount":"0","resultStr":null,"platform":"Semanticscholar","paperid":null,"PeriodicalName":"Green Energy and Intelligent Transportation","FirstCategoryId":"1085","ListUrlMain":"https://www.sciencedirect.com/science/article/pii/S2773153724000239","RegionNum":0,"RegionCategory":null,"ArticlePicture":[],"TitleCN":null,"AbstractTextCN":null,"PMCID":null,"EPubDate":"","PubModel":"","JCR":"","JCRName":"","Score":null,"Total":0}
引用次数: 0
Abstract
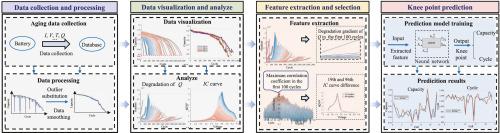
Analyzing capacity degradation characteristics and accurately predicting the knee point of capacity are crucial for the safety management of lithium-ion batteries (LIBs). However, the degradation mechanism of LIBs is complex. A key but challenging problem is how to clarify the degradation mechanism and predict the knee point. According to the external characteristics such as capacity decline gradievnt and the peak value of increment capacity curve (IC curve), the capacity degradation can be divided into four stages, including initial decline stage, slow decline stage, transition stage and high-speed decline stage. The degradation mechanism of LIBs is compared from the longitudinal and horizontal aspects, respectively. Among them, the battery usage from the initial stage to the end of life (EOL) is longitudinal analysis. The battery under different conditions, such as charging and discharging, different discharge rate, different cathode material degradation mechanism is horizontal analysis. Moreover, a method based on neural network is proposed to predict the knee point. Two features are used to predict the capacity and cycle of the knee point, which are the gradient of the capacity degradation curve and the difference of the IC curve with the maximum correlation. The experimental results show that a two-dimensional surface can be obtained using only the first 100 cycles, which can provide a reference for the position of the knee point accurately prediction.

 求助内容:
求助内容: 应助结果提醒方式:


