Jacqueline A Piekos, Jeewoo Kim, Jacob M Keaton, Jacklyn N Hellwege, Todd L Edwards, Digna R Velez Edwards
{"title":"EVALUATING THE RELATIONSHIPS BETWEEN GENETIC ANCESTRY AND THE CLINICAL PHENOME.","authors":"Jacqueline A Piekos, Jeewoo Kim, Jacob M Keaton, Jacklyn N Hellwege, Todd L Edwards, Digna R Velez Edwards","doi":"","DOIUrl":null,"url":null,"abstract":"<p><p>There is a desire in research to move away from the concept of race as a clinical factor because it is a societal construct used as an imprecise proxy for geographic ancestry. In this study, we leverage the biobank from Vanderbilt University Medical Center, BioVU, to investigate relationships between genetic ancestry proportion and the clinical phenome. For all samples in BioVU, we calculated six ancestry proportions based on 1000 Genomes references: eastern African (EAFR), western African (WAFR), northern European (NEUR), southern European (SEUR), eastern Asian (EAS), and southern Asian (SAS). From PheWAS, we found phecode categories significantly enriched neoplasms for EAFR, WAFR, and SEUR, and pregnancy complication in SEUR, NEUR, SAS, and EAS (p < 0.003). We then selected phenotypes hypertension (HTN) and atrial fibrillation (AFib) to further investigate the relationships between these phenotypes and EAFR, WAFR, SEUR, and NEUR using logistic regression modeling and non-linear restricted cubic spline modeling (RCS). For EAS and SAS, we chose renal failure (RF) for further modeling. The relationships between HTN and AFib and the ancestries EAFR, WAFR, and SEUR were best fit by the linear model (beta p < 1x10⁻⁴ for all) while the relationships with NEUR were best fit with RCS (HTN ANOVA p = 0.001, AFib ANOVA p < 1x10⁻⁴). For RF, the relationship with SAS was best fit with a linear model (beta p < 1x10⁻⁴) while RCS model was a better fit for EAS (ANOVA p < 1x10⁻⁴). In this study, we identify relationships between genetic ancestry and phenotypes that are best fit with non-linear modeling techniques. The assumption of linearity for regression modeling is integral for proper fitting of a model and there is no knowing a priori to modeling if the relationship is truly linear.</p>","PeriodicalId":34954,"journal":{"name":"Pacific Symposium on Biocomputing. Pacific Symposium on Biocomputing","volume":"29 ","pages":"389-403"},"PeriodicalIF":0.0000,"publicationDate":"2024-01-01","publicationTypes":"Journal Article","fieldsOfStudy":null,"isOpenAccess":false,"openAccessPdf":"https://www.ncbi.nlm.nih.gov/pmc/articles/PMC10802858/pdf/","citationCount":"0","resultStr":null,"platform":"Semanticscholar","paperid":null,"PeriodicalName":"Pacific Symposium on Biocomputing. Pacific Symposium on Biocomputing","FirstCategoryId":"1085","ListUrlMain":"","RegionNum":0,"RegionCategory":null,"ArticlePicture":[],"TitleCN":null,"AbstractTextCN":null,"PMCID":null,"EPubDate":"","PubModel":"","JCR":"Q2","JCRName":"Computer Science","Score":null,"Total":0}
引用次数: 0
Abstract
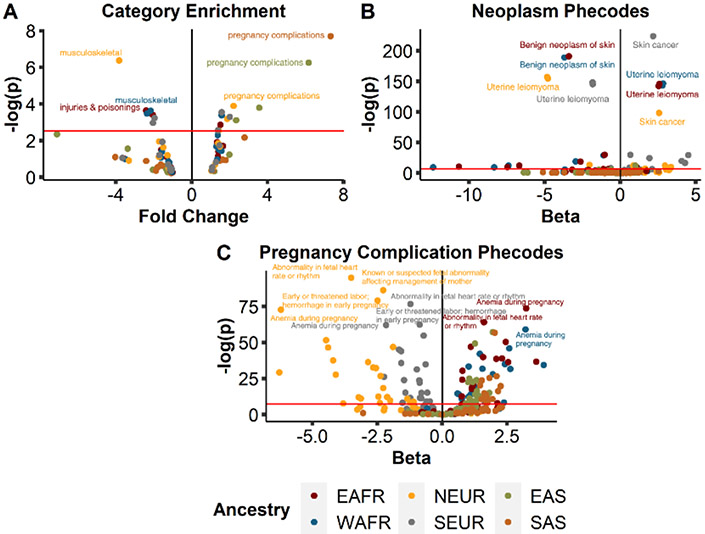
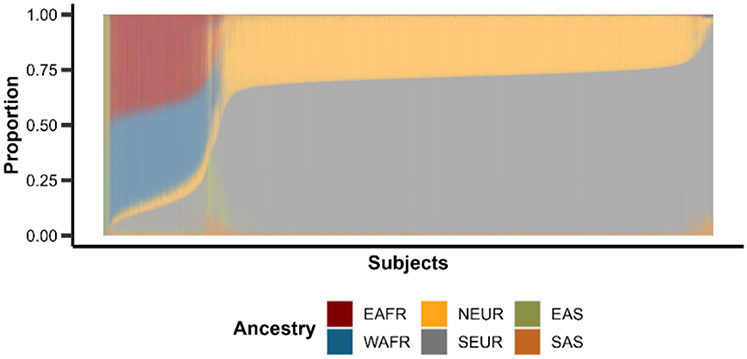
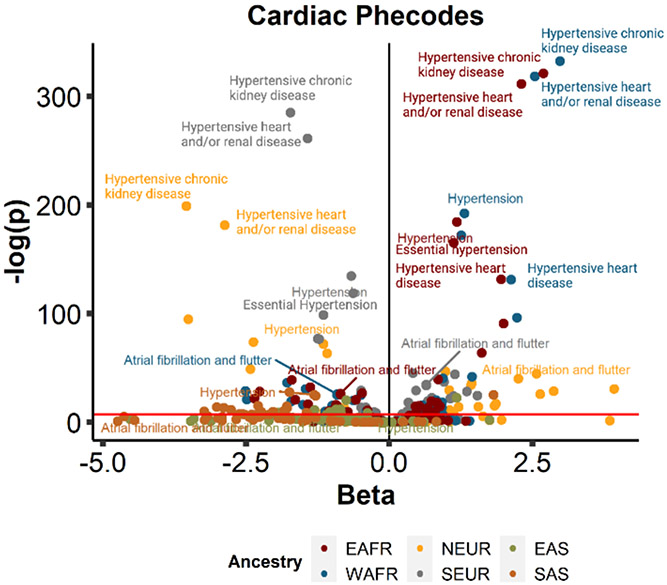
There is a desire in research to move away from the concept of race as a clinical factor because it is a societal construct used as an imprecise proxy for geographic ancestry. In this study, we leverage the biobank from Vanderbilt University Medical Center, BioVU, to investigate relationships between genetic ancestry proportion and the clinical phenome. For all samples in BioVU, we calculated six ancestry proportions based on 1000 Genomes references: eastern African (EAFR), western African (WAFR), northern European (NEUR), southern European (SEUR), eastern Asian (EAS), and southern Asian (SAS). From PheWAS, we found phecode categories significantly enriched neoplasms for EAFR, WAFR, and SEUR, and pregnancy complication in SEUR, NEUR, SAS, and EAS (p < 0.003). We then selected phenotypes hypertension (HTN) and atrial fibrillation (AFib) to further investigate the relationships between these phenotypes and EAFR, WAFR, SEUR, and NEUR using logistic regression modeling and non-linear restricted cubic spline modeling (RCS). For EAS and SAS, we chose renal failure (RF) for further modeling. The relationships between HTN and AFib and the ancestries EAFR, WAFR, and SEUR were best fit by the linear model (beta p < 1x10⁻⁴ for all) while the relationships with NEUR were best fit with RCS (HTN ANOVA p = 0.001, AFib ANOVA p < 1x10⁻⁴). For RF, the relationship with SAS was best fit with a linear model (beta p < 1x10⁻⁴) while RCS model was a better fit for EAS (ANOVA p < 1x10⁻⁴). In this study, we identify relationships between genetic ancestry and phenotypes that are best fit with non-linear modeling techniques. The assumption of linearity for regression modeling is integral for proper fitting of a model and there is no knowing a priori to modeling if the relationship is truly linear.

 求助内容:
求助内容: 应助结果提醒方式:


