{"title":"Transmission Dynamics and Short-Term Forecasts of COVID-19: Nepal 2020/2021.","authors":"Sushma Dahal, Ruiyan Luo, Raj Kumar Subedi, Meghnath Dhimal, Gerardo Chowell","doi":"10.3390/epidemiologia2040043","DOIUrl":null,"url":null,"abstract":"<p><p>Nepal was hard hit by a second wave of COVID-19 from April-May 2021. We investigated the transmission dynamics of COVID-19 at the national and provincial levels by using data on laboratory-confirmed RT-PCR positive cases from the official national situation reports. We performed 8 week-to-week sequential forecasts of 10-days and 20-days at national level using three dynamic phenomenological growth models from 5 March 2021-22 May 2021. We also estimated effective and instantaneous reproduction numbers at national and provincial levels using established methods and evaluated the mobility trends using Google's mobility data. Our forecast estimates indicated a declining trend of COVID-19 cases in Nepal as of June 2021. Sub-epidemic and Richards models provided reasonable short-term projections of COVID-19 cases based on standard performance metrics. There was a linear pattern in the trajectory of COVID-19 incidence during the first wave (deceleration of growth parameter (<i>p</i>) = 0.41-0.43, reproduction number (Rt) at 1.1 (95% CI: 1.1, 1.2)), and a sub-exponential growth pattern in the second wave (<i>p</i> = 0.61 (95% CI: 0.58, 0.64)) and Rt at 1.3 (95% CI: 1.3, 1.3)). Across provinces, Rt ranged from 1.2 to 1.5 during the early growth phase of the second wave. The instantaneous Rt fluctuated around 1.0 since January 2021 indicating well sustained transmission. The peak in mobility across different areas coincided with an increasing incidence trend of COVID-19. In conclusion, we found that the sub-epidemic and Richards models yielded reasonable short-terms projections of the COVID-19 trajectory in Nepal, which are useful for healthcare utilization planning.</p>","PeriodicalId":72944,"journal":{"name":"Epidemiolgia (Basel, Switzerland)","volume":"2 4","pages":"639-659"},"PeriodicalIF":0.0000,"publicationDate":"2021-12-16","publicationTypes":"Journal Article","fieldsOfStudy":null,"isOpenAccess":false,"openAccessPdf":"https://www.ncbi.nlm.nih.gov/pmc/articles/PMC9620946/pdf/","citationCount":"6","resultStr":null,"platform":"Semanticscholar","paperid":null,"PeriodicalName":"Epidemiolgia (Basel, Switzerland)","FirstCategoryId":"1085","ListUrlMain":"https://doi.org/10.3390/epidemiologia2040043","RegionNum":0,"RegionCategory":null,"ArticlePicture":[],"TitleCN":null,"AbstractTextCN":null,"PMCID":null,"EPubDate":"","PubModel":"","JCR":"","JCRName":"","Score":null,"Total":0}
引用次数: 6
Abstract
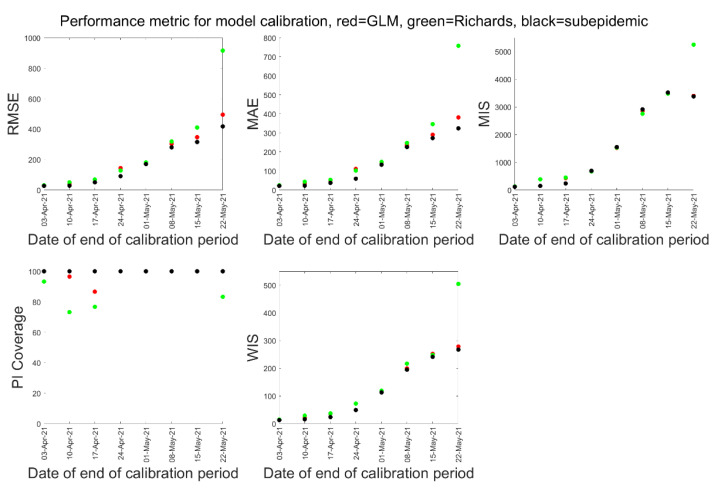
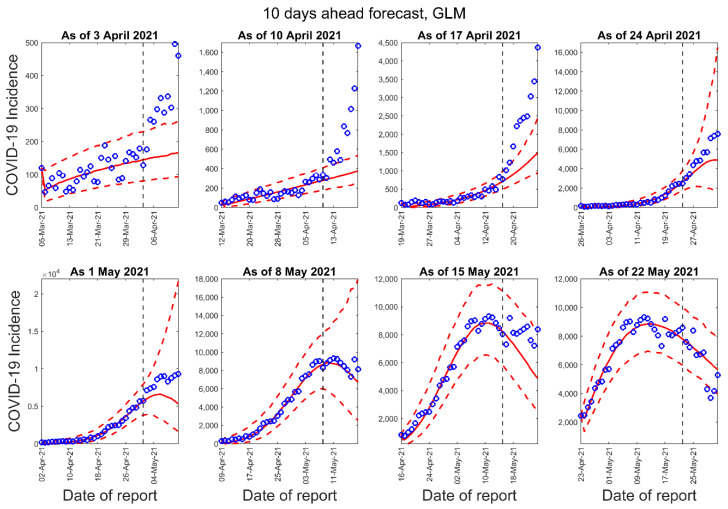
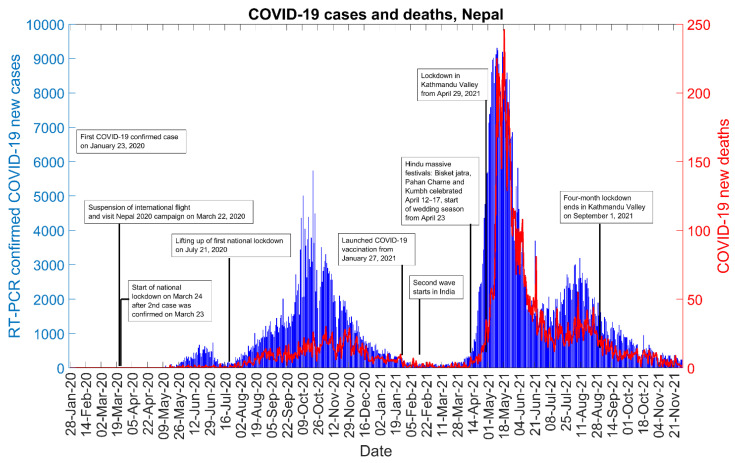
Nepal was hard hit by a second wave of COVID-19 from April-May 2021. We investigated the transmission dynamics of COVID-19 at the national and provincial levels by using data on laboratory-confirmed RT-PCR positive cases from the official national situation reports. We performed 8 week-to-week sequential forecasts of 10-days and 20-days at national level using three dynamic phenomenological growth models from 5 March 2021-22 May 2021. We also estimated effective and instantaneous reproduction numbers at national and provincial levels using established methods and evaluated the mobility trends using Google's mobility data. Our forecast estimates indicated a declining trend of COVID-19 cases in Nepal as of June 2021. Sub-epidemic and Richards models provided reasonable short-term projections of COVID-19 cases based on standard performance metrics. There was a linear pattern in the trajectory of COVID-19 incidence during the first wave (deceleration of growth parameter (p) = 0.41-0.43, reproduction number (Rt) at 1.1 (95% CI: 1.1, 1.2)), and a sub-exponential growth pattern in the second wave (p = 0.61 (95% CI: 0.58, 0.64)) and Rt at 1.3 (95% CI: 1.3, 1.3)). Across provinces, Rt ranged from 1.2 to 1.5 during the early growth phase of the second wave. The instantaneous Rt fluctuated around 1.0 since January 2021 indicating well sustained transmission. The peak in mobility across different areas coincided with an increasing incidence trend of COVID-19. In conclusion, we found that the sub-epidemic and Richards models yielded reasonable short-terms projections of the COVID-19 trajectory in Nepal, which are useful for healthcare utilization planning.

 求助内容:
求助内容: 应助结果提醒方式:


