Alexey Yakovlev, Alexandra Gritskova, Andrei Manzhurtsev, Maxim Ublinskiy, Petr Menshchikov, Anatoly Vanin, Dmitriy Kupriyanov, Tolib Akhadov, Natalia Semenova
{"title":"Dynamics of γ-aminobutyric acid concentration in the human brain in response to short visual stimulation.","authors":"Alexey Yakovlev, Alexandra Gritskova, Andrei Manzhurtsev, Maxim Ublinskiy, Petr Menshchikov, Anatoly Vanin, Dmitriy Kupriyanov, Tolib Akhadov, Natalia Semenova","doi":"10.1007/s10334-023-01118-7","DOIUrl":null,"url":null,"abstract":"<p><strong>Objective: </strong>To find a possible quantitative relation between activation-induced fast (< 10 s) changes in the γ-aminobutyric acid (GABA) level and the amplitude of a blood oxygen level-dependent contrast (BOLD) response (according to magnetic resonance spectroscopy [MRS] and functional magnetic resonance imaging [fMRI]).</p><p><strong>Materials and methods: </strong>fMRI data and MEGA-PRESS magnetic resonance spectra [echo time (TE)/repetition time (TR) = 68 ms/1500 ms] of an activated area in the visual cortex of 33 subjects were acquired using a 3 T MR scanner. Stimulation was performed by presenting an image of a flickering checkerboard for 3 s, repeated with an interval of 13.5 s. The time course of GABA and creatine (Cr) concentrations and the width and height of resonance lines were obtained with a nominal time resolution of 1.5 s. Changes in the linewidth and height of n-acetylaspartate (NAA) and Cr signals were used to determine the BOLD effect.</p><p><strong>Results: </strong>In response to the activation, the BOLD-corrected GABA + /Cr ratio increased by 5.0% (q = 0.027) and 3.8% (q = 0.048) at 1.6 and 3.1 s, respectively, after the start of the stimulus. Time courses of Cr and NAA signal width and height reached a maximum change at the 6th second (~ 1.2-1.5%, q < 0.05).</p><p><strong>Conclusion: </strong>The quick response of the observed GABA concentration to the short stimulus is most likely due to a release of GABA from vesicles followed by its packaging back into vesicles.</p>","PeriodicalId":18067,"journal":{"name":"Magnetic Resonance Materials in Physics, Biology and Medicine","volume":" ","pages":"39-51"},"PeriodicalIF":2.5000,"publicationDate":"2024-02-01","publicationTypes":"Journal Article","fieldsOfStudy":null,"isOpenAccess":false,"openAccessPdf":"","citationCount":"0","resultStr":null,"platform":"Semanticscholar","paperid":null,"PeriodicalName":"Magnetic Resonance Materials in Physics, Biology and Medicine","FirstCategoryId":"3","ListUrlMain":"https://doi.org/10.1007/s10334-023-01118-7","RegionNum":4,"RegionCategory":"医学","ArticlePicture":[],"TitleCN":null,"AbstractTextCN":null,"PMCID":null,"EPubDate":"2023/9/16 0:00:00","PubModel":"Epub","JCR":"Q3","JCRName":"RADIOLOGY, NUCLEAR MEDICINE & MEDICAL IMAGING","Score":null,"Total":0}
引用次数: 0
Abstract
Objective: To find a possible quantitative relation between activation-induced fast (< 10 s) changes in the γ-aminobutyric acid (GABA) level and the amplitude of a blood oxygen level-dependent contrast (BOLD) response (according to magnetic resonance spectroscopy [MRS] and functional magnetic resonance imaging [fMRI]).
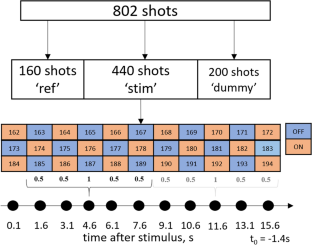
Materials and methods: fMRI data and MEGA-PRESS magnetic resonance spectra [echo time (TE)/repetition time (TR) = 68 ms/1500 ms] of an activated area in the visual cortex of 33 subjects were acquired using a 3 T MR scanner. Stimulation was performed by presenting an image of a flickering checkerboard for 3 s, repeated with an interval of 13.5 s. The time course of GABA and creatine (Cr) concentrations and the width and height of resonance lines were obtained with a nominal time resolution of 1.5 s. Changes in the linewidth and height of n-acetylaspartate (NAA) and Cr signals were used to determine the BOLD effect.
Results: In response to the activation, the BOLD-corrected GABA + /Cr ratio increased by 5.0% (q = 0.027) and 3.8% (q = 0.048) at 1.6 and 3.1 s, respectively, after the start of the stimulus. Time courses of Cr and NAA signal width and height reached a maximum change at the 6th second (~ 1.2-1.5%, q < 0.05).
Conclusion: The quick response of the observed GABA concentration to the short stimulus is most likely due to a release of GABA from vesicles followed by its packaging back into vesicles.
期刊介绍:
MAGMA is a multidisciplinary international journal devoted to the publication of articles on all aspects of magnetic resonance techniques and their applications in medicine and biology. MAGMA currently publishes research papers, reviews, letters to the editor, and commentaries, six times a year. The subject areas covered by MAGMA include:
advances in materials, hardware and software in magnetic resonance technology,
new developments and results in research and practical applications of magnetic resonance imaging and spectroscopy related to biology and medicine,
study of animal models and intact cells using magnetic resonance,
reports of clinical trials on humans and clinical validation of magnetic resonance protocols.
 求助内容:
求助内容: 应助结果提醒方式:


